Adoption of Wind Energy in the U.S.
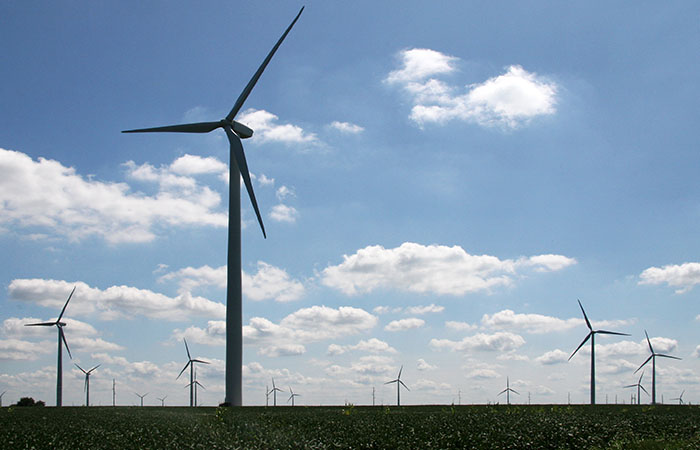
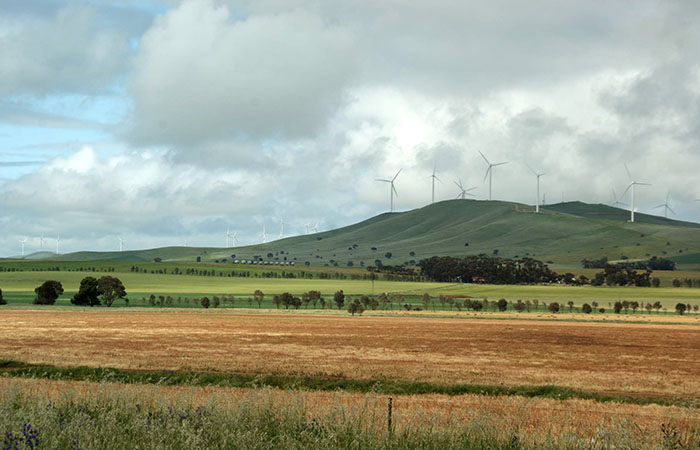
Wind power captures the natural wind in our atmosphere and converts it into mechanical energy and ultimately electricity. Wind energy has been around since recorded history, starting with use in sail boats as early as 5,000 B.C. and wind mills for grinding grain in the 1800s. It wasn’t until 1890 that wind energy began being experimented with as a means to produce electricity and not until 1970 that commercial wind energy was explored as a viable option. The combination of increasing prices for fossil fuels and the rise of environmental movements and subsequently federal environmental policies (Clean Air Act, Clean Water Act, National Environmental Policy Act) sparked an interest in renewable energy. That is to say, energy that is sustainable and has limited negative effects on the natural environment. Today, wind energy is a rapidly growing industry, largely due to federal policy and the need to find renewable sources of energy to supplement fossil fuels in an environment of ever growing population. The following visualizations show past, current, and projected trends for wind energy in the United States.

Choropleth Map Showing Installed Wind Energy Capacity (MW) by State from 1981 to Present
The following visualization utilizes wind turbine data from the United States Geological Survey (USGS) (database of over 47,000 turbines). The dataset was put together from a variety of sources and begins in 1981 (with the first major utility-scale wind farm in California) to the present. Using GIS software, these wind turbine points were spatially joined to a GIS dataset of state boundaries and statistics about the data were linked to state boundaries.
The resulting dataset is shown below, where color classes show total installed wind energy capacity per state for each year (see the time slider). California lead the way in terms of wind energy development for about a decade until about 1992 when the Energy Policy Act was signed, allowing an energy production tax credit for wind power which revitalized interest in renewable energy in a time of rising gas prices. At around the year 2000 a drastic increase in wind capacity per state can start to be seen.
State
| Year | {Hover} |
|---|---|
| Total Capacity (MW) | {Hover} |
| Total Number of Turbines | {Hover} |
| Mean Height of Turbines (m) | {Hover} |
| Mean Blade Length (m) | {Hover} |
| Mean Rotor Sweep Area | {Hover} |
Parallel Coordiantes Diagram Showing Wind Energy Statistics by State for 2014
The American Wind Energy Association advocates for the increase of wind energy in the United States and in doing so collects a large amount of metrics on wind energy development per state. The following visualization shows wind energy statistics for U.S. states in 2014. Statistics include such areas as total wind energy capacity per state, jobs provided by the wind energy sector, wind energy facilities in each state, water saved by developing wind energy (instead of other water intensive energy sources like natural gas), and green-house gas emissions avoided by using a clean renewable source. The following diagram has states broken into regions by color: west, mid-west, southwest, northeast, and southeast. Each line on the graph represents a state and shows their various wind energy statistics. Try clicking and dragging on an axis to filter the dataset!
{Hover}
| Installed Wind Capacity (MW) | {Hover} |
|---|---|
| Capacity Under Construction | {Hover} |
| Wind Projects Online | {Hover} |
| Number of Turbines | {Hover} |
| 2014% of In-State Energy from Wind | {Hover} |
| Wind Industry Jobs | {Hover} |
| Wind Manufacturing Facilities | {Hover} |
| Total Project Investment (billions) | {Hover} |
| Annual Land Lease Payments (millions) | {Hover} |
| Annual Water Savings (billions of gallons) | {Hover} |
| CO2 Emissions Avoided (millions of metric tons) | {Hover} |
State Regions
Total Installed Capacity (MW) by Region
When Does Wind Generate the Most Energy?
Like solar energy, wind energy is highly variable in its availability—the wind does not always blow just as the sun does not always shine. While it’s easy to expect when solar power’s generative capacity will drop to negligible levels—namely, during the night—because we can observe day and night directly, it’s much harder to predict capacity from wind based on casual observation.
In order to get an idea of hourly trends in capacity output from wind, this visualization dives into a detailed look at data from California, one of the leading states in the U.S. in wind energy adoption. The plot shows daily output by hour for nearly 6 years (each line represents one day), between April 2010 and April 2016.
Insights
- Winds blow most strongly at night, and dip significantly during the day.
- Many days have little to no wind, and thus produce little power from wind.
Hourly Output from Wind in California, 2010–2016
Filter by hour of day:
Hours are on a 24-hour schedule. The time zone is GMT -08:00 (Pacific).
- 8 — 8 am
- 12 — noon
- 16 — 4 pm
- 20 — 8 pm
Source: California Independent System Operator (CAISO)
www.caiso.com/Pages/default.aspx
Projected Wind Capacity By State Through 2030
In 2008, the National Renewable Energy Laboratory (NREL) published a report outlining a plan for the United States to generate 20% of its energy from wind by 2030. In order to achieve this target, NREL projects the generative capacity from wind needed by each state, in 6-year intervals starting in 2012.
This visualization classifies states according to the minimum target in each category set by NREL for a given state in a given year.
Is the U.S. on track to achieve 20% by 2030?
Based on actual output data from 2014, half the country—25 states—had already met or exceeded their 2018 target projected wind capacity.
Just one state, Nebraska, needs to add 1,000MW or more of wind power capacity in order to meet NREL’s 2018 target projected wind capacity. 5 states (North Carolina, New Jersey, Nebraska, South Dakota, and Wyoming) need to add 1,000MW or more of wind capacity by 2024 in order to meet NREL’s targets.
Three states, Alabama, Louisiana, and Mississippi, generate zero or negligible ( < 100 MW) power from wind under the NREL 20% by 2030 Scenario.
Source: National Renewable Energy Laboratory
www.nrel.gov